How we built a video ingestion pipeline for 60× scale headroom
Building a high-volume video ingestion system for a scale target that refused to hold still, and the three times it pushed back and taught us something.
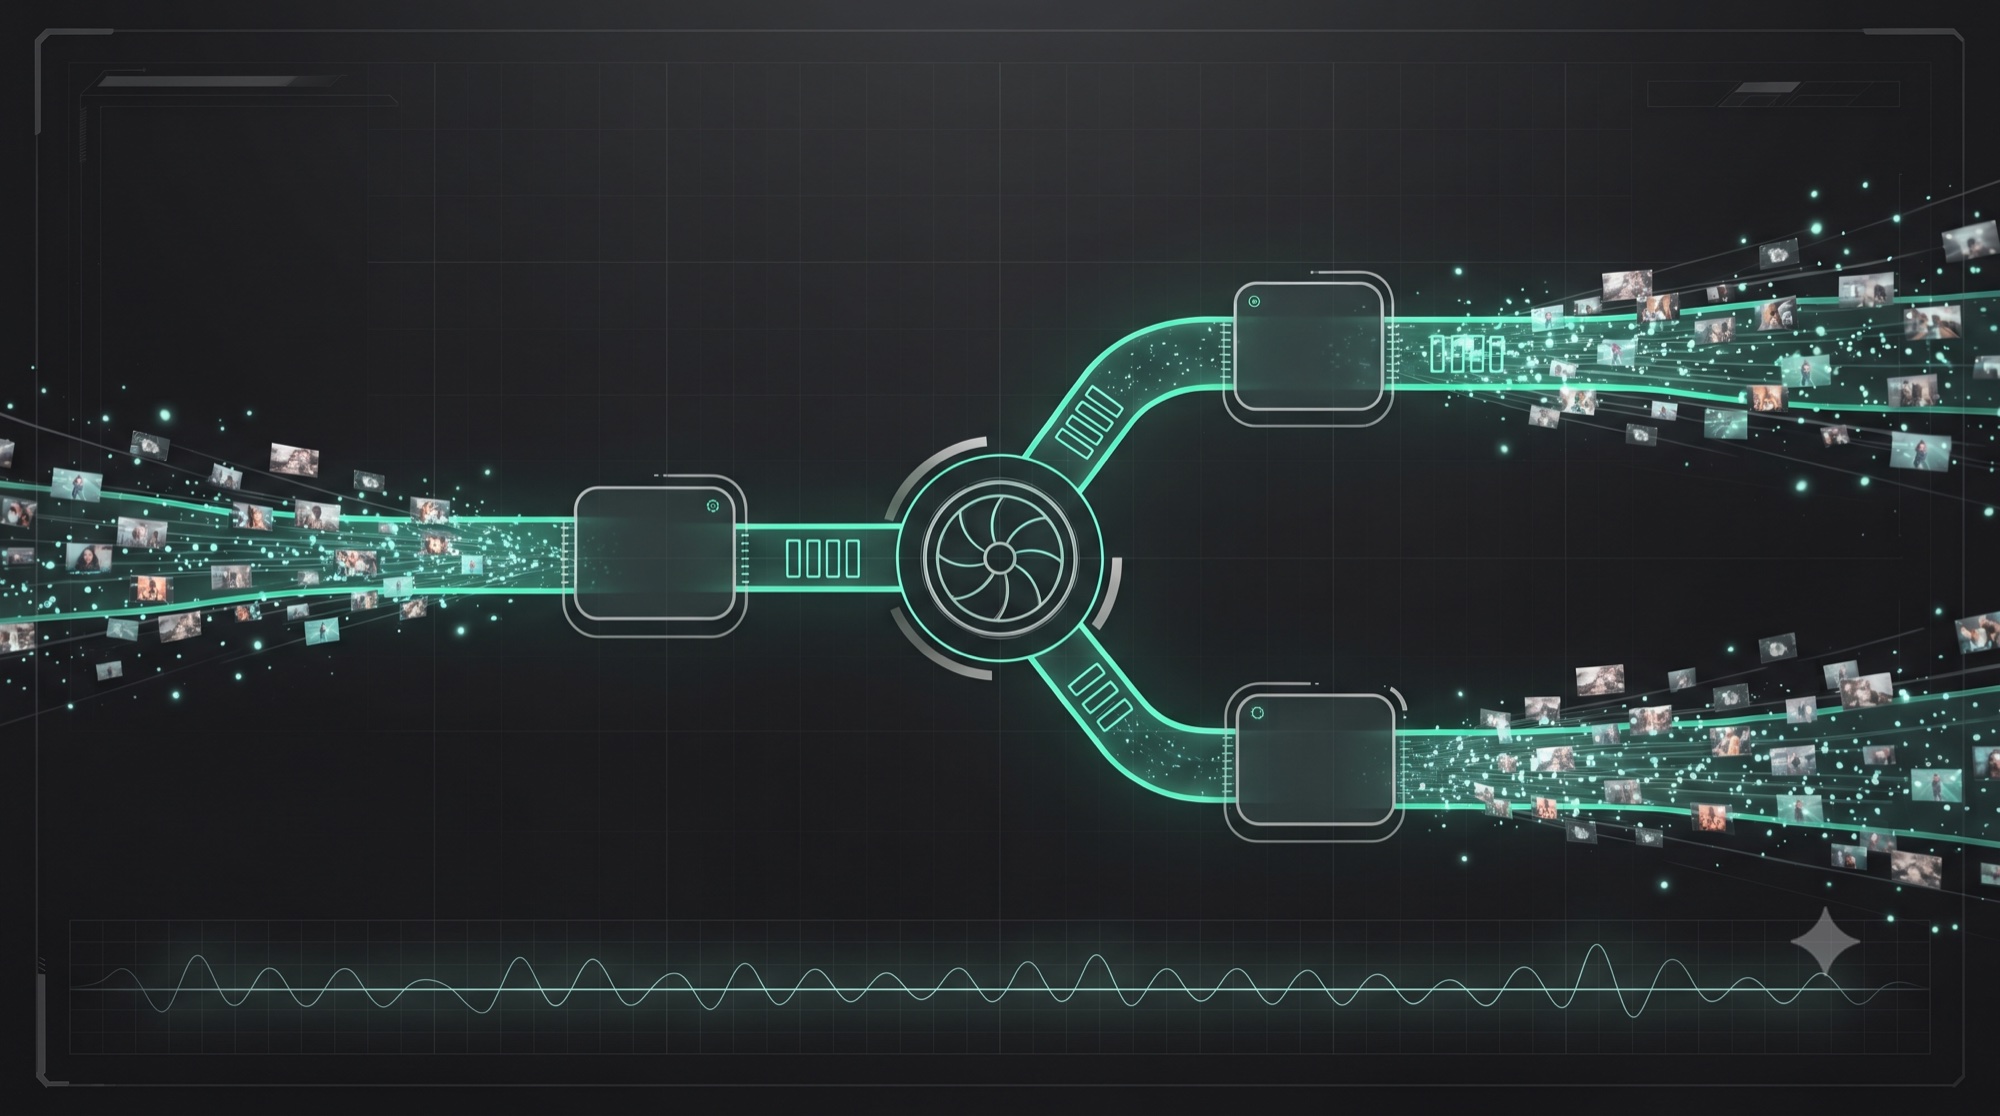
Most systems are built for the load they have. This one had to be built for a load nobody could name yet. When we started, the target was “around 30 million items a day.” By the time we were in production it had been re-baselined to 2 million, with the 30M number still standing as the direction of travel. Somewhere in that range was the real system, and we had to build something that didn’t need rewriting when the number moved.
This is a note on how we did it: the architecture, the decisions that created the headroom, how we knew it worked, and three moments where the system pushed back. We were a small mixed team, a couple of platform consultants plus the client’s own engineers. Everything below is “we”; the hindsight at the end is mine.
The domain, in one line: ingest high-volume public video content from across the open web, enrich it (metadata, downloaded media, machine transcription), index it, and expose search over it.
What we were building
The job was a searchable, near-real-time index of public video: not a crawl-once dataset but a continuously updating one. As videos are published across the open web, the system finds each one within seconds, downloads the video and pulls its metadata, works out whether anyone is speaking and in what language, transcribes the speech to text, and makes the whole record (caption, transcript, metadata) searchable within about five minutes of the video going live. A user can then query “show me recent videos that mention X” and get answers off a corpus that’s minutes old.
Three forces pull against each other the entire time: volume (a firehose that could reach tens of millions of new items a day), freshness (minutes, not hours), and a scope that kept moving as the product found its shape. Almost every decision below is about holding those three in tension, so that when one of them changes (the volume target changed by more than an order of magnitude mid-project) the design bends instead of breaking. And the volume was a guess. We were building for a number nobody could pin down, which is a different problem from building for a big one.
Six stages, no shared state, queues in between
The pipeline is six stages joined by queues: discover → fetch → detect-language → transcribe → index → search. Each stage is its own service (containers on ECS/EC2) with its own input queue and its own autoscaling policy, and it knows nothing about its neighbours beyond a message schema. Services physically can’t import each other’s code; a build rule fails the compile if they try. That reads like a style rule; it’s the decision everything else depends on. Because the only coupling between stages is a queue, each one scales on its own backlog and a slow stage becomes a growing queue rather than an outage propagating upstream.
Stages talk through queues fed by fan-out topics, so a producer can add consumers without knowing they exist. Message schemas are versioned as discriminated unions, so two versions can coexist on a queue during a rolling deploy. Autoscaling is driven off queue depth, not CPU. The honest signal for a pipeline is how much work is waiting, and CPU-based scaling lags it badly.
We chose managed queues over a streaming log and containers-on-VMs over Kubernetes. The language call was a real bake-off: a colleague wrote the scanner in Go, I wrote it in Node. Go came out about 15% faster on the hot path. We shipped Node anyway. Our stack is Node, and a 15% edge on one service didn’t justify carrying a second language. Every one of these was a “smaller team, fewer moving parts” call.
Where the headroom comes from
Four decisions carry the headroom, and none of them is “add more machines.” That part is easy once the design lets you.
One coverage knob, independent of fleet size
Ingestion volume is governed by a single configuration value that sets how much of the available stream we take in, read live each cycle, held completely separate from how many workers run. One knob is coverage, fleet size is speed; they’re orthogonal. Moving between operating points is one value changed live: no redeploy, no effect on in-flight work. That single indirection is most of why the scale target could move without the architecture moving with it.
Idempotency, so retries are free
Two properties make retries safe end to end. First, the discovery→fetch hop runs on FIFO queues keyed per video for both grouping and deduplication, so a duplicate discovery inside the window is collapsed before anyone pays to fetch it. Second, as the diagram shows, the indexer’s document is assembled by three producers arriving in any order, any number of times. So writes are scripted upserts keyed to the same document, with nulls stripped so a late partial can’t clobber a field that’s already there:
POST content_index/_update/{id}
{
  "scripted_upsert": true,
  "script": { "source":
    "for (e in params.doc.entrySet()) if (e.value != null) ctx._source[e.key] = e.value" },
  "upsert": {},
  "retry_on_conflict": 3          // concurrent same-id writes converge
}
Create-then-merge and merge-then-create converge to byte-identical documents. Once every write is order-independent and replay-safe, you can retry aggressively, and aggressive retries are what let the pipeline ride out a flaky upstream instead of dropping data.
Backpressure, with a deliberate hole in it
Between fetch, audio, transcription and index, a queue absorbs every rate mismatch. Long units of work keep their lock alive with a visibility heartbeat that re-extends at a third of the timeout, and interrupted work is never deleted; a shutdown mid-unit just lets the message redeliver. But discovery is deliberately not back-pressured by downstream: if it falls too far behind real time, it advances its cursor and sheds the backlog rather than queue work that’s already going stale. For a freshness product, current-but-incomplete beats complete-but-late. We picked which property to protect, on purpose.
Failure isolation as a default
Every queue has a dead-letter queue at three attempts. Every service but the orchestrator is stateless and disposable. The services themselves own almost no durable state; the one exception is a small cursor record, and everything heavy lives in the object store and the search cluster, which are built to be stateful. The CPU-bound stages run competing-consumer worker pools (N loops each doing pull-one, process, repeat) instead of pulling a batch and awaiting it, so one slow item can’t stall the nine behind it. When something breaks, it breaks in one lane.
One thing worth saying plainly, because it took us a while to accept: the ceiling was never the scanning. Scanning compute you scale by adding tasks. The real limit is the shared egress out to the open web. That’s finite in a way compute isn’t, and every scaling conversation came back to it.
Tested against the real thing
A pipeline that fans out across six services and three storage systems can’t be verified by unit tests that mock their way around the hard parts. So we didn’t mock. Across roughly 550 test cases, vi.fn, vi.mock and vi.spyOn appear zero times; the rule is enforced, not aspirational. Verification is built from the outside in.
The safety net that matters is the tests that stand up the real thing in containers: real message queues, a real object store, a real search cluster, and the actual service Docker images, not test doubles. About 180 tests run this way, of which the heaviest 30-odd are full end-to-end system tests, backed by a dedicated internal package whose only job is a container factory per service. The search acceptance test seeds a synthetic corpus into the queue, runs the real indexer image to apply the schema, boots the real indexer service to consume and write into a real search cluster, then queries the API over HTTP and asserts the result. It was written before the search service existed; its own header calls it “the test that guides the service: RED until the service is built inward.” The acceptance test was the specification.
Two habits sat on either side of that net. Every service began as a design doc committed to the repo (roughly 2,900 lines of them across system design, capacity model, index mapping and the search contract), reviewed and “signed” on a fixed four-phase rhythm (design, review, PR plan, implement) before a line of service code, then built as a dependency-ordered sequence of PRs rather than discovered in the editor.
And we validated against real data, not just synthetic fixtures. We ran the actual mapping code across a real staging dump to measure things you can’t guess. That corrected a vendor’s 50 KB-per-document cluster-sizing assumption down to a measured ~2 KB, which changed the hardware. A field-presence audit over a couple thousand real records shaped the index mapping and exposed two schema bugs (a field that was a string where we’d typed a number; a duration in milliseconds we’d read as seconds). And we checked search correctness by planting a known set of real posts and comparing results side-by-side against a reference store, where they diverged became tickets, not opinions.
The acceptance test came first. Building the service was making it go green.
What the system taught us the hard way
01 · Scaling wall (discovery) · The circuit breaker that synchronised the fleet
We wrapped the discovery worker’s outbound validation call in a circuit breaker, the textbook move, tuned conservatively: trip after five requests at a 50% error rate, reset after thirty seconds. What the textbook omits is that our workers shared one pool of egress infrastructure. When it degraded, every worker’s breaker saw the same failure rate and tripped in the same second. On open, our handler aborted the whole assignment. The abort returned the message to the queue; the next worker leased it, hit the same degraded dependency, aborted again, and on the third receive it dead-lettered.
The fix had two halves. Stop treating “circuit open” as “fail the work”; treat it as “wait”:
while (breaker.opened) {
  await sleep(WAIT_MS + jitter());  // jitter so the fleet doesn't wake in lockstep
}                                    // heartbeat keeps the message invisible; no receive burned
return breaker.fire(req);            // only shutdown aborts; everything else retries in place
The jitter matters: without it, “wait then retry” just moves the synchronised stampede a second to the right, so every worker still wakes together and re-trips the breaker in lockstep. Jitter spreads the wake-ups, and the breaker’s reset is a single half-open trial rather than the whole fleet firing at once. Then retune so it fires on a real outage, not on the ambient error rate of a dependency that fails a fraction of calls by nature: threshold to 75% over a thirty-second window with a volume floor of a hundred requests, reset probe every five seconds. The retry budget stopped being spent on a dependency that was going to fail the same way three times in a row.
02 · Misleading bug (search) · The pagination that impersonated a capacity problem
Load-testing search, the cluster began returning 429 across the board: “too many point-in-time contexts.” It read like we’d outgrown the search tier. We hadn’t. Deep pagination opened a point-in-time reader per result page to mint a stable cursor, released only if the caller paged all the way to the end. Almost nobody pages to the end. Each reader lived for its keep-alive window, and under load the single-page searches (the overwhelming majority) opened them faster than they expired, until we hit the cluster-wide cap and every query started failing, regardless of size.
We deleted the point-in-time approach entirely and made the cursor stateless: an opaque token carrying only the sort key of the last hit, resolved against the live index on the next call:
// cursor = base64url( JSON.stringify(lastHit.sort) )
GET content_index/_search
{ "size": N, "sort": [ … ], "search_after": decode(cursor) }
Zero server-side state, so nothing to leak and unbounded concurrent paginators. The tradeoff we accepted out loud: this gives best-effort consistency, not a frozen snapshot, so a document indexed mid-traversal can shift a page boundary. For an append-mostly index that’s fine, and a strict point-in-time export was deferred to a separate internal path.
03 · Cost win (language detection) · The GPU we were about to buy and didn’t
Language detection gates the expensive transcription step; only allowed-language clips go on to transcribe. We’d implemented it by running a general speech model on CPU, and under load it pinned at ~95% and became the pipeline’s bottleneck. The obvious fix was GPUs, alongside transcription. We built that migration and measured it before committing, and the GPU sat ~94% idle. Per message ran ~2.6s end to end, but the model forward pass was ~0.3 to 0.6s of it; the rest was audio decode, voice-activity detection, and feature extraction, all on the CPU. Which meant the GPU couldn’t keep up either: two nodes cleared maybe 290 clips a minute against a firehose north of 700 a minute. A fleet of mostly-idle GPUs isn’t an answer.
So we went the other way. The model that finally kept pace I found at about 2am, once it was clear the GPU path was a dead end: a small ~85 MB classifier built for exactly one job, on cheap CPU. I cut the input work feeding it, too. It cleared the inbound stream (roughly 125K clips in under five hours, dead-letter rate under 0.03%), kept pace on commodity cores, and handed the entire GPU pool back to transcription, where the forward pass dominates and a GPU earns its cost. The CPU classifier that replaced the GPU fleet we were about to provision runs at a fraction of the cost. Measuring the migration before funding it is what stopped the spend.
What I’d do differently
I’d model the shared-dependency failure mode before reaching for the circuit breaker; the correlated-trip behaviour is obvious once you say “shared” and “fleet” in the same sentence. I’d have caught the point-in-time leak with one test: issue a single-page search and assert the server-side reader count returns to baseline. And I’d have killed the “provision a database and a cache for now” reflex sooner. Both were deleted unused, and while they sat there they were a false signal that the system was more stateful than it is. The real shape (queues, object store, search index, one tiny cursor) was there from the start.
For teams building similar systems
Make one config value your global throttle and keep it independent of fleet size. Put a queue between every pair of stages and decide, per boundary, whether overload should wait or shed; don’t let it be an accident. Make every write order-independent and replay-safe before you let yourself retry aggressively, because aggressive retries are your cheapest availability. Verify from the outside in against real infrastructure, and validate against real data: the design doc settles the arguments, the system test catches the bugs, and real data catches the assumptions. And when a stage is slow, profile where the milliseconds go before you buy the resource that looks scarce; the bottleneck is usually one layer over from where it hurts.
None of this is exotic. Most of it is a refusal to couple things that don’t need coupling, which is what lets one number move without dragging the rest of the system along with it.
Doron Tsur leads platform and data-infrastructure engagements at Codo: distributed systems, search, and the infrastructure underneath them.